Polling Post-Mortem: Examining 2020

“I’m Here To Remind You That Trump Can Still Win,” declared statistician and University of Chicago graduate Nate Silver in a headline two days before the 2020 presidential election.
Silver and his website, FiveThirtyEight, have become the gold standard for election models and the go-to for journalists, pundits, and political geeks. And Silver’s model determined a clear favorite this year, giving former vice president and eventual president-elect Joe Biden an 89 percent chance of winning the Electoral College, compared to only 10 percent for incumbent president Donald Trump—the other one percent was roughly the odds of an Electoral College tie. Biden’s odds had been slowly rising since late August, when the model and its perpetually cheery mascot Fivey Fox had given Biden only a 69 percent probability of winning. The electoral college and popular vote predictions had followed similar paths, marking Biden as the race’s clear frontrunner. However, in the days approaching the election Silver emphasized that a ten percent chance was not nothing: “All the election models are bullish on Biden,” he wrote, “but they are united in that a Trump win is still plausible despite his seemingly steep deficit in polls.”
Weighted and Unweighted Polling
Polling forms the foundation of election predictions. FiveThirtyEight created its model using its own polling averages, which aim to reduce the uncertainty inherent in polling by collecting and comparing large numbers of polls. However, Silver and his team do not use a straightforward average; instead, they grade pollsters on a scale from A+ to F and weight each poll more or less heavily based on how accurate they expect them to be. The goal is to handle polls of differing quality differently: If a pollster has been more accurate in the past and uses more scientific polling methods, Silver expects them to maintain their accuracy in the future and allows them to have a larger influence on FiveThirtyEight’s polling average.
Due to the uncertainty in polling, some organizations other than FiveThirtyEight feel less comfortable evaluating pollsters on accuracy. These organizations calculate polling averages without weighting; RealClearPolitics (RCP) is one such website. Therefore, in RCP’s average, each poll, regardless of past accuracy, is considered with equal strength. Because these two methods produce different results, we can compare both weighted and unweighted polling averages on a state-by-state level with the actual results in each state to gain valuable insights into both polling and weighting.
We can split eleven of the most-watched swing states into two regions. On the one hand, there are the Sun Belt swing states: Arizona, Florida, Georgia, Nevada, North Carolina, and Texas. On the other hand lie the Midwestern states: Iowa, Michigan, Ohio, Pennsylvania, and Wisconsin.
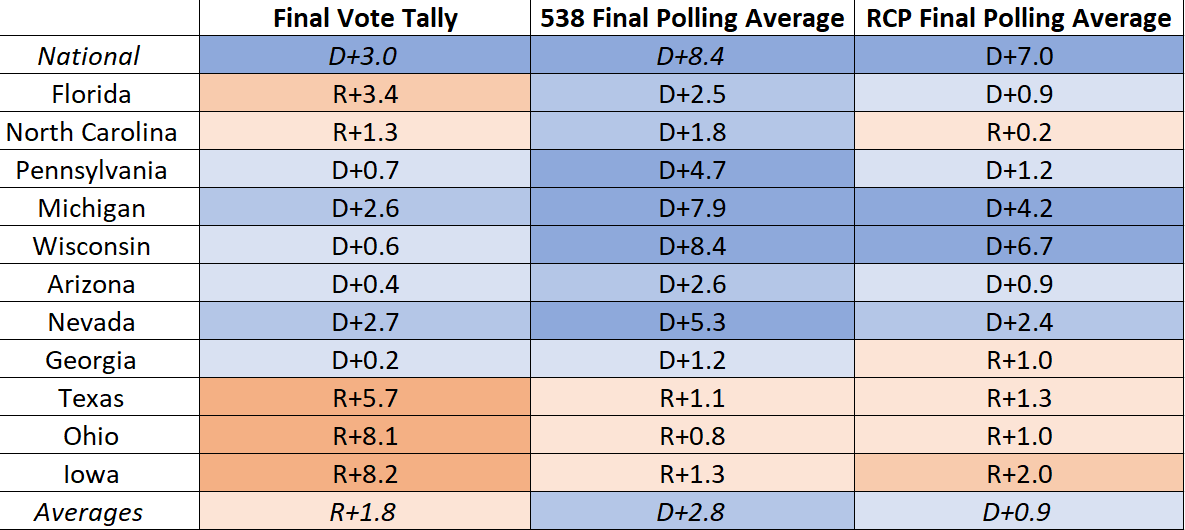
As of November 10, 2020. Final vote tallies subject to change. “Averages” only includes states, not the national margin of victory. Sources: The Washington Post, FiveThirtyEight, RealClearPolitics.
Subtracting each polling average from the final vote tally provides us with how far off each organization’s polling average was in each state from the final election results:
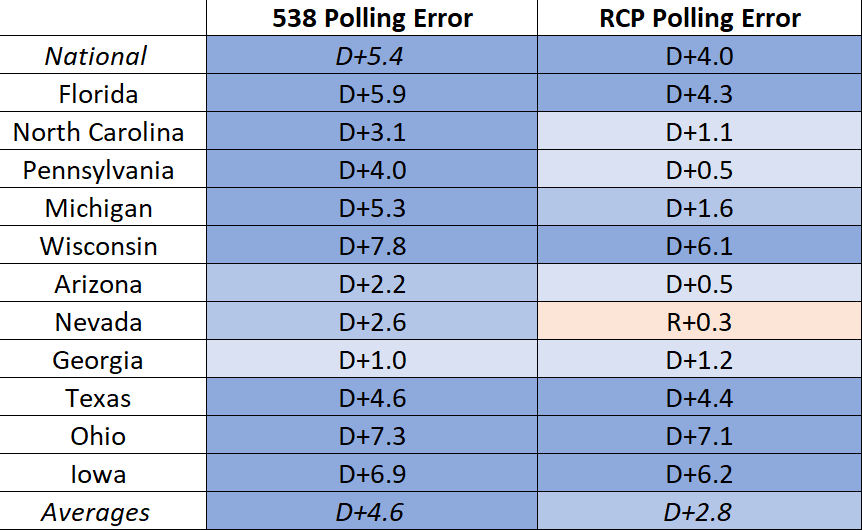
This blue-as-the-sky chart makes one thing clear: The polls did, indeed, nearly universally overestimate Biden’s strength in key swing states. Only in Nevada did either average underestimate Biden, and there RCP did so only by the slimmest of margins. Notably, the weights FiveThirtyEight uses to “unskew” polls in fact worsened this effect, with FiveThirtyEight’s state-level polling error almost two full percentage points more biased towards Biden on average than RealClearPolitics’s.
Margin of Error
A fundamental aspect of polling is the “margin of error,” which provides a range within which a pollster is confident the correct measurement lies. For example, if a poll found Joe Biden at 50 percent approval in a state with a three-point margin of error, the pollster would be very confident (usually 95 percent confident) that Biden’s “true” approval among all the state’s voters was between 47 and 53 percent. While 50 percent approval is the pollster’s best guess, there exists a natural, random, unpredictable uncertainty in polling that is impossible to eliminate.
A polling average is supposed to alleviate this uncertainty. For perfect polls, errors will occur randomly—some boosting the Republican, others boosting the Democrat—in such a way that averaging large numbers of polls would find an answer as close to the true value as possible. Some averages might slightly overestimate Biden’s performance, and others might expect Trump to do better, but in general these effects will be small and balance out. Since the degree of error we see for FiveThirtyEight and RealClear politics is both large and one-directional, it is far from random, suggesting that the polls systemically undercounted Trump voters not just in one state, but in almost all of these swing states.
The errors also appear to be regionalized. Both the RCP and FiveThirtyEight averages did considerably better among the Sun Belt swing states, with errors of D+1.5 and D+3.2 respectively. However, polling was simply a fiasco in the Midwestern swing states: RCP’s Midwestern state polls favored Biden on average by an extra 4.3 points, and FiveThirtyEight favored Biden by a full 6.3 points. The state most accurately measured by FiveThirtyEight was Georgia, whereas RCP’s best measurement was Nevada. The worst state for both organizations was Ohio, where each overestimated support for Biden by more than 7 percentage points, making the Buckeye State look like a swing state when it was decidedly not one.
One source of this regionalized error appears to be pollsters’ mismeasurement of a few key groups that decided the 2016 election: women, senior citizens, and white voters. Examining a Monmouth poll in Georgia and a Quinnipiac poll in Ohio just before the election, and comparing them to CNN’s exit polls, we find that Biden’s support among these groups was correctly estimated in Georgia but far overestimated in Ohio:
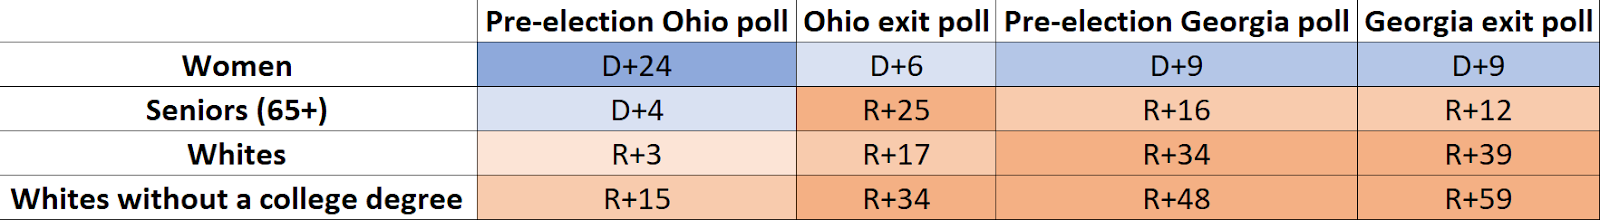
Sources: Monmouth, Quinnipiac, CNN
What exactly caused this polling error remains to be seen, and as more information rolls in, we will gain a clearer picture. One popular conjecture is the “shy Trump voter” theory, the notion that Trump’s supporters are less likely to speak honestly with pollsters. Shy Trump voters could do this on purpose—Republicans are much less likely to trust the news media and polling organizations, and therefore may be less likely to agree to participate in polls or to tell the truth when they do. A shy Trump voter effect could also be by accident, if Trump voters are harder to reach by phone and are undersampled by pollsters because of it.
Probability Forecasting
FiveThirtyEight uses its polling averages to produce its aforementioned probability forecast, which attempts to calculate the odds of each candidate winning each state. Comparing the probabilities that this year’s model and previous FiveThirtyEight models conferred to each state, and how that state eventually voted, we can plot the accuracy of each model since 2008:
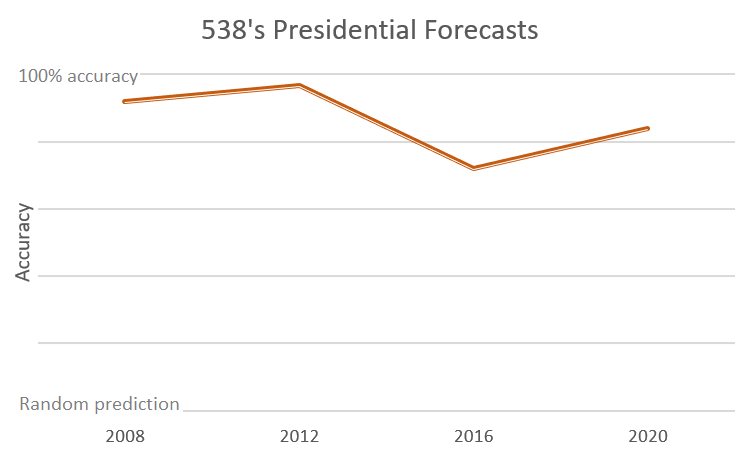
Y-axis is (1 – Brier score). “Random prediction” uses a prediction of each major party candidate having a 50 percent chance of winning each state. “100% accuracy” is if it is predicted that each candidate has a 100 percent chance of winning every state they eventually win and a 0 percent chance of winning all other states.
FiveThirtyEight’s models predicted each of the Obama elections quite well, but took a serious hit in 2016. However, it appears to have partially rebounded this year, perhaps because it now factors in how differently-educated voters vote differently, a fact that was responsible for much of 2016’s polling errors.
This increase in model accuracy is heartening. However, the polling and weighting errors discussed above, almost all overestimating Biden’s strengths, shed a worrying light on polling in a post-Trump America. Whether polls become more accurate under the Biden administration remains yet to be seen. At the moment, however, we can firmly say that there is something wrong with the state of polling in this country that should give journalists, public opinion researchers, and the American people pause.
The header image is licensed under the Pixabay License, which can be found here. No changes were made to the original image, which is attributed to Niek Verlaan and can be found here. All other graphics were created by the author.
Jake Biderman
Jake Biderman is a fourth-year political science major interested in law, journalism, and governance. He has worked for outlets including the Des Moines Register and Fox News, covering the Democratic primaries and a Democratic presidential debate. When he’s not worrying about Americans’ critical thinking skills, he’s exercising, learning foreign languages, or watching baseball. Go Nats!